
Profitability Framework: understanding revenue, costs and profit
The primary aim of most businesses is to generate profit. To generate profit, a business’ revenue (or "turnover"/"sales") must exceed the aggregate value of its fixed costs and variable costs.
The Profitability Framework can help you to analyse the key drivers of a business' profits (or losses). It can be applied to elements of case studies that involve issues relating to profitability, for example where a business you are analysing has experienced changes in profitability, revenues generated and/or costs incurred. For instance, if a fictional client has experienced a drop in sales or is struggling to control its costs, this framework may help you to assess and discuss the potential sources of the problem and propose potential solutions.
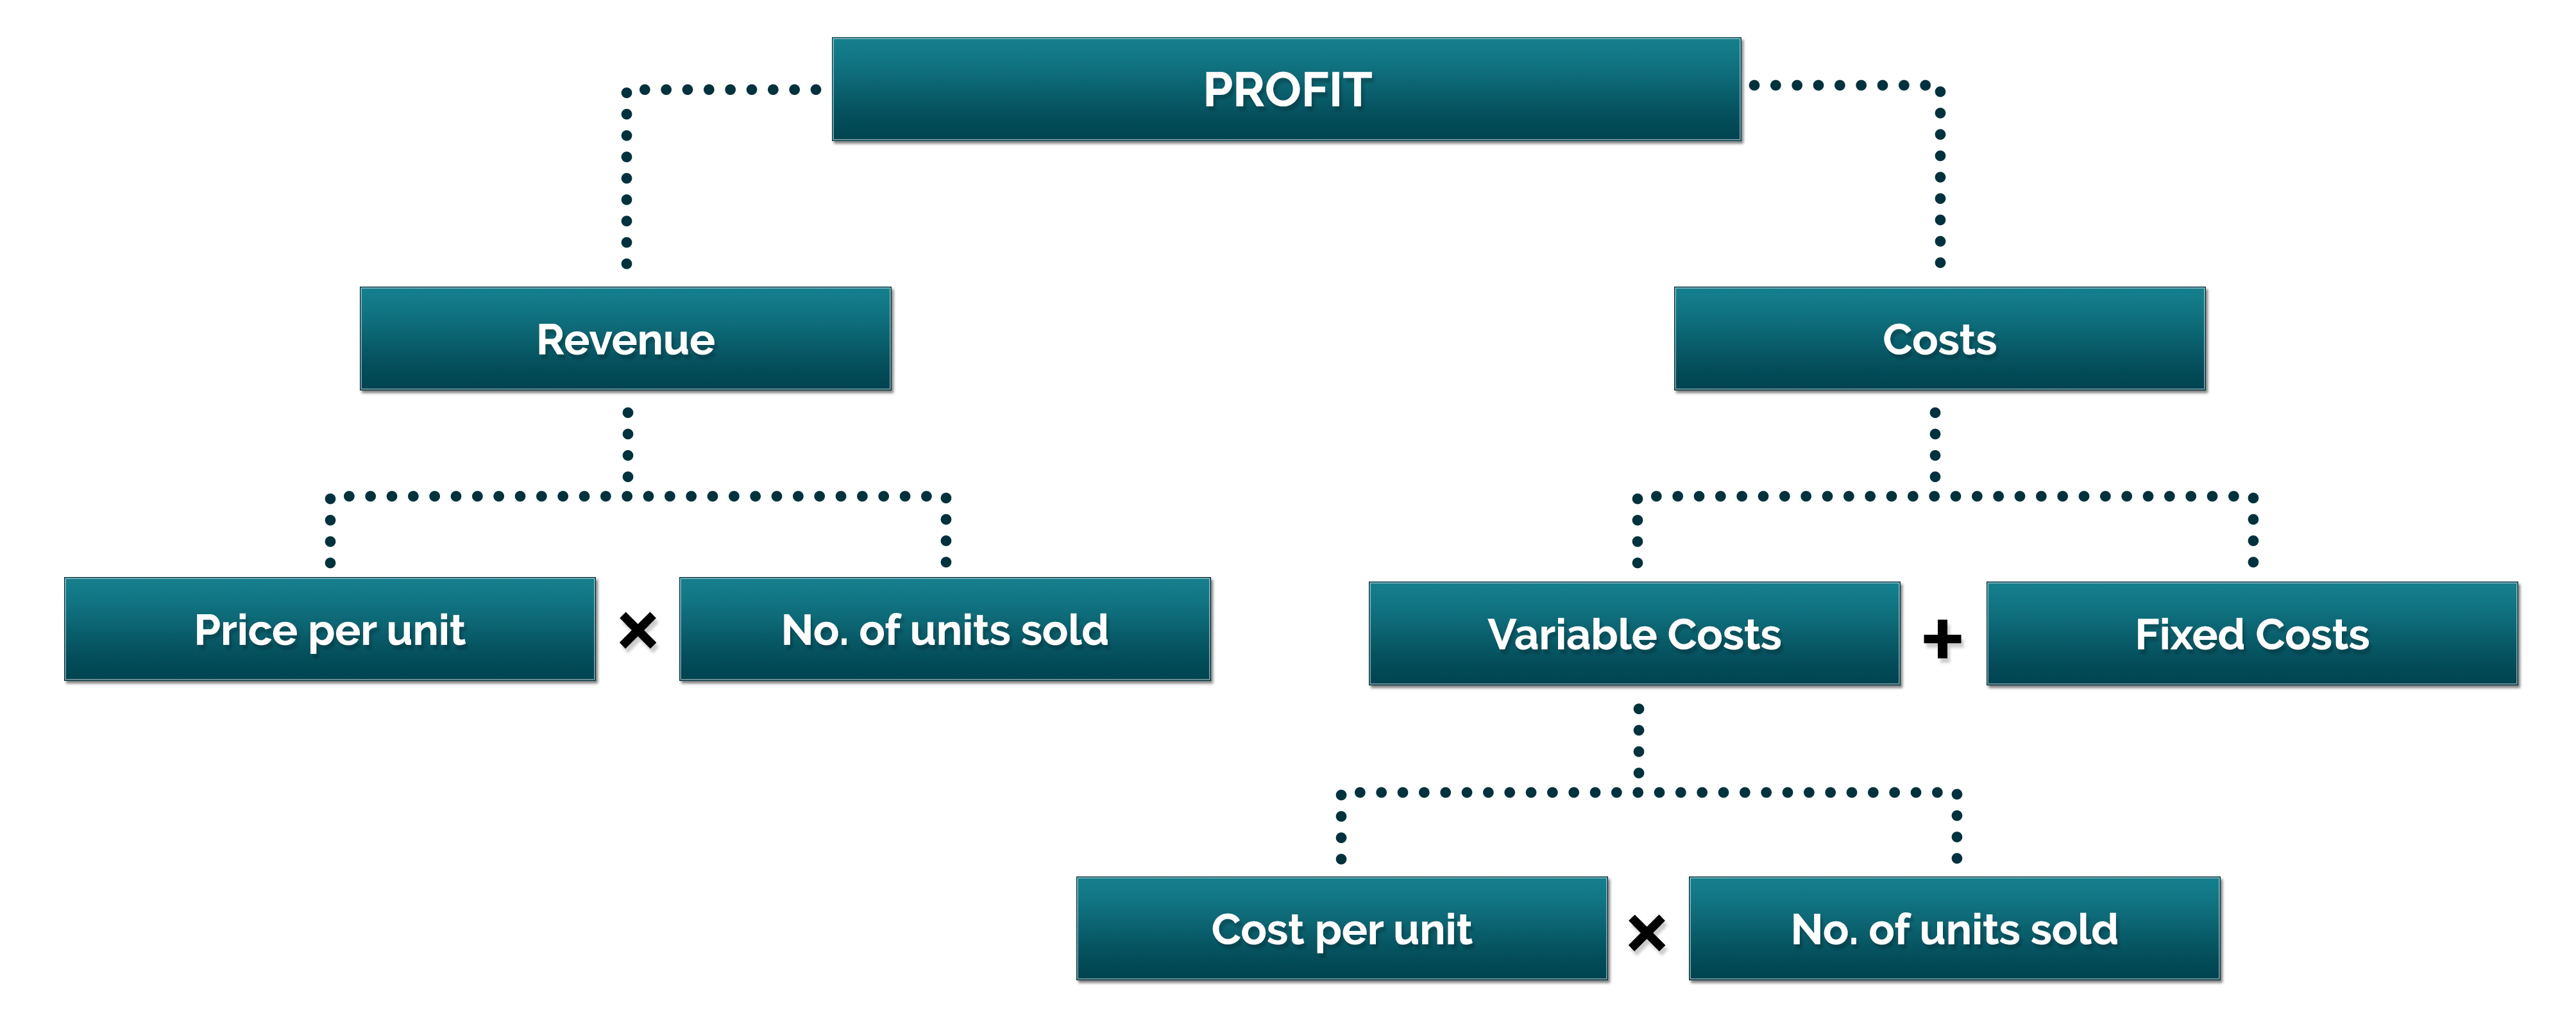
Revenue / turnover / sales: the total income generated from a firm’s operations within a period of time. This does not take into account costs, instead purely reflecting the money that has been received from sales. For example, if a company sells 10 handbooks for £10 each, its revenue would be £100.
Fixed costs: business costs that remain the same regardless of the number of units produced or sold. Examples include: the rent paid for an office or a factory; the cost of paying utility bills; or the cost of fuel for an aeroplane flight. These costs will all remain the same (or almost the same) regardless of whether a company sells 0 or 1,000 units.
Variable costs: costs that change in relation to the number of units produced or sold, for instance the cost of packaging or delivering each individual product. Labour to some extent is a variable cost as over time, the number of employees may change to reflect a company’s level of output. However, in the short term, labour is generally deemed to be a fixed cost.
You may need to walk your interviewer through each step you take when applying the Profitability Framework to a case study. When doing so, explain which "branches" of the framework you are considering (e.g. the "Costs" or ‘Revenues’ branch). If you decide to switch branches, explain why you have decided to do so.
You could start by stating that the two main components of profitability are revenue and costs and that the difference between these two metrics gives you the profit figure. If your interviewer has not specified whether the company has a revenue or costs problem, consider asking them whether either (or both) of these two metrics have changed.
Revenues
If revenues have decreased and costs have not changed, this suggests that the issue relates to revenues. Your next step should therefore be to assess the branches underneath "Revenues" in order to determine whether that change is the result of a fall in the price per unit or a fall in the number of units sold. If however revenues have remained stable but costs have increased, you should work your way down the "Costs" branch instead.
Costs
The total cost figure depends on both variable and fixed costs, so you need to determine which of the two types of costs has increased.
- If variable costs have increased, then drill down further to determine if the change relates to the cost per unit or the number of units sold.
- If fixed costs have increased, you may have to segment the fixed costs to see whether a certain type of fixed cost has increased to an unsatisfactory extent. Remember that an increase in fixed costs may indicate investment has taken place (e.g. investment in new plant and machinery), which in the long-term could increase revenues and improve profitability (even if profitability has been negatively impacted in the short-term).
A drop in profitability may sometimes be driven by a combination of changes on both the revenues and costs sides. If this is the case, you should drill down both branches (separately) until you find the source(s) of the problem.