
Numerical reasoning tests: introduction and top tips
Numerical reasoning tests
I have never seen a law firm set a standalone numerical reasoning test as part of its recruitment process, although I once completed an email simulation exercise which included a few questions that were similar to numerical reasoning test questions. For this reason, I thought I would offer some tips for approaching these types of questions.
Numerical reasoning tests are designed to assess your ability to quickly and accurately identify, process and analyse numerical data, including statistics. Most numerical reasoning questions require only basic arithmetic, with the required calculations usually focusing on addition, subtraction, multiplication, division and calculating percentages or fractions.
This means you don’t need to be a maths genius to determine the right answers. Personally, I had not studied Maths for around 7 years (and was not particularly confident with numbers) when I first faced these tests. However, I still managed to pass them, even though friends of mine studying numbers-focused degrees failed on a number of occasions.
Format
Numerical reasoning tests typically present you with a graph or table containing numbers and percentages, followed by a series of questions that require you to identify specific numbers from the graph or table and then plug those numbers into one or more calculations to reach the correct answer. These tables or graphs may contain data relating to a broad range of subjects, for example, different companies, locations, product lines, sales figures or periods of time.
Approach
Whilst the types of calculations expected of you may be fairly simple, numerical reasoning tests tend to put you under extreme time pressure, especially if certain questions require you to carry out multiple calculations in order to determine the answers. An ability to work quickly, calmly and accurately is therefore crucial. Attention to detail is also essential, as if you don’t accurately identify the correct figures to plug into your calculations, then you won’t reach the right answers, no matter how good you are at maths.
If you’re faced with a table of data, make sure you carefully read the headings along the top and down the side before selecting which numbers to focus on. With graphs, pay attention to the axes, the key, and any additional information contained within the graph itself.
Have a calculator, some paper and a pen ready. Perhaps start by reading each question very carefully and then isolating and noting down the relevant figures from the table or graph before making any calculations. Taking this approach can help you to avoid accidentally including the wrong information in your calculations as a result of focusing on too much at once.
Example questions
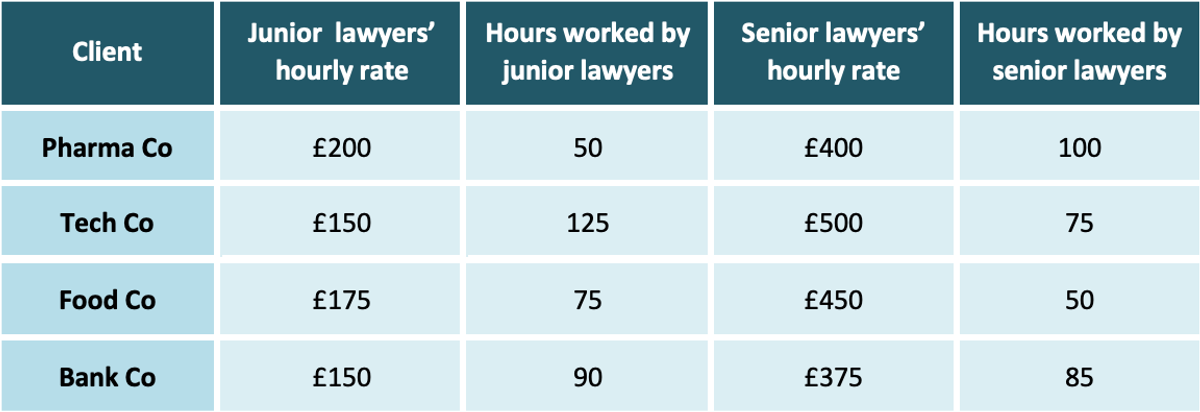
The below table sets out the hourly rates that a law firm has agreed with four of its clients, as well as the number of hours that junior and senior lawyers have worked for each of those clients to date.
1. What is the total fee payable by Food Co for the work carried out to date by senior lawyers?
Start by identifying the relevant information in the table. We’re asked specifically about Food Co, so we know we need to focus on the Food Co row. We’re also asked specifically about the fees generated by senior lawyers, so we know we need to focus on the fourth and fifth columns (and ignore any figures relating to junior lawyers).
We’re told that the senior hourly rate for Food Co is £450 and that senior lawyers have worked 50 hours in total for Food Co, so the calculation we need to carry out is £450 p/h x 50 hours. This tells us that £22,500 is payable by Food Co for the work carried out to date by senior lawyers.
2. What is the difference between the total fees payable by Pharma Co and the total fees payable by Bank Co?
A tougher question might ask, for instance, what the difference is between the total fees payable by Pharma Co and Bank Co. If you’re asked a question like this, which requires multiple calculations, it’s imperative that you take a methodical approach to finding the right answer. Attention to detail is key, as you likely won’t have time to carefully check all your workings afterwards.
For this question, we know we’re being asked about the difference in “total fees”, which indicates we’ll need to calculate both the junior fees and the senior fees owed by Pharma Co and Bank Co.
Once we’ve determined that these are the key calculations, I would start by carefully identifying and noting down each number that you’ll need to plug into those calculations. Noting down this information means you won’t need to keep looking back at the table, and can also help you to keep track of what you have calculated and what you still need to calculate in order to reach the answer.
Starting with Pharma Co:- We need to multiply the £200 p/h charged by juniors by the 50 hours worked by juniors, which tells us that juniors have generated £10,000 in fees.
- We then need to multiply the £400 p/h charged by seniors by the 100 hours worked by seniors, which tells us that seniors have generated £40,000 in fees.
- Finally, we need to add together the £10,000 payable in relation to juniors and £40,000 payable in relation to seniors, which tells us that Pharma Co owes £50,000 in total.
- We need to multiply the £150 p/h charged by juniors by the 90 hours worked by juniors, which tells us that juniors have generated £13,500 in fees.
- We then need to multiply the £375 p/h charged by seniors by the 85 hours worked by seniors, which tells us that seniors have generated £31,875 in fees.
- Adding these figures together tells us that Bank Co owes £45,375 fees generated.
It can be really easy to miss or forget one or more of these steps, so triple check the question to make sure you’re using the right figures and not missing out any important calculations.